We have an unwavering conviction in how we invest. Our approach starts with understanding that markets work.
For decades investors have been trying to “beat the market” by picking the right fund, the hot hand, or the great manager, and in most cases they have failed.
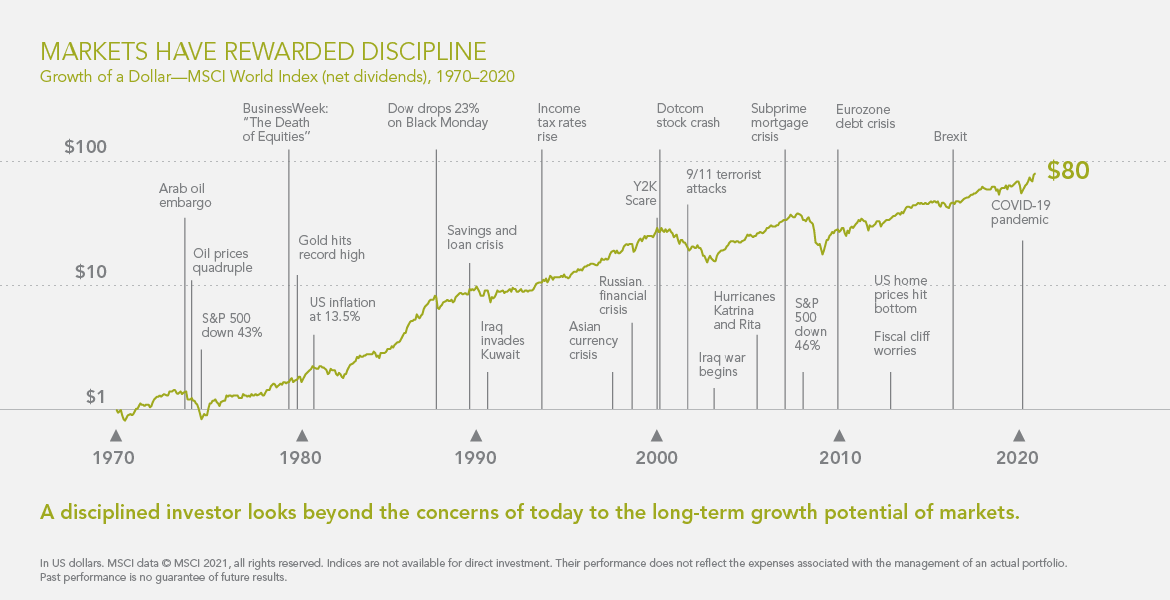
Markets reward discipline. To build wealth you must look beyond the concerns of today, which oftentimes appear to be gloomy, and invest for the long term.
Your rate of return is determined by the structure of your portfolio, or in other words, what asset classes you invest in and how much you have allocated among them. But where do returns come from? Risk.
Sources of Returns1: Financial capital plays a vital role in wealth creation. Using financial capital and other resources, a business produces goods or services that can be sold for a profit. When individuals invest in a business they purchase either a stock or a bond from companies that need to raise capital. Stocks and bonds are conduits for capital. Bondholders are lenders to a company and stockholders are equity owners in the business. Both expect an adequate return for the terms and risk of their investments.
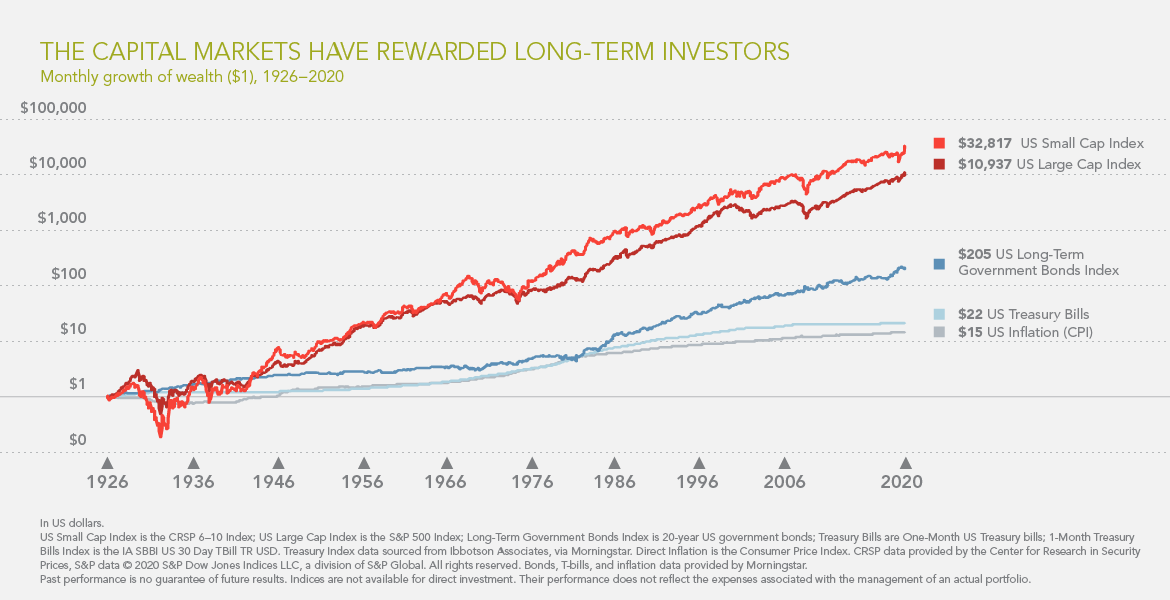
Long-term investors have been rewarded for providing capital to the markets.
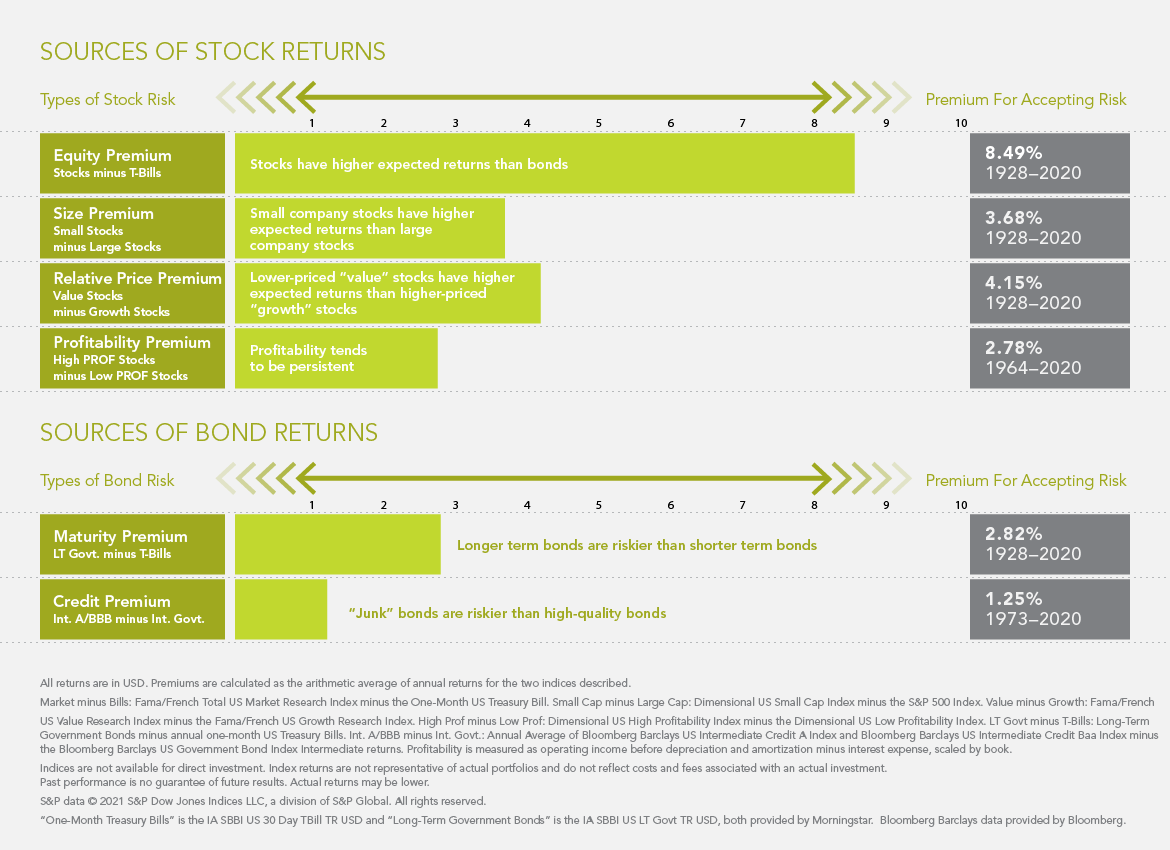
Investors have been rewarded because of a fundamental truism: risk and return are related. Risk is a complex concept; it is always present, even if it has not been realized, and cannot be directly observed until it occurs. The sources of return, however, are directly observable. Financial research has identified these sources, which are persistent in markets around the world and across different time periods. Much of what we have learned about expected investment returns can be summarized as follows2.
At Hemington Wealth Management, we structure our portfolios to take advantage of what financial science has taught us, and we align portfolios with the individual goals of our clients and their financial plans. We avoid the noise of the media, the latest crisis du jour, and instead focus on what can be controlled:
- Creating an investment plan to fit your needs and risk tolerance
- Structuring a portfolio around sources of returns
- Diversifying broadly
- Reducing expenses and turnover
- Minimizing taxes
- Indices are not available for direct investment; therefore, their performance does not reflect the expenses associated with the management of an actual portfolio. Past performance is no guarantee of future results. US Market Index is the CRSP 1-10 Index; Long-Term Bonds Index is 20-year US government bonds; Treasury Bills are One-Month US Treasury bills; Inflation is the Consumer Price Index. CRSP data provided by the Center for Research in Security Prices, University of Chicago. Bonds, T-bills, and inflation data © Stocks, Bonds, Bills, and Inflation Yearbook ™, Ibbotson Associates, Chicago (annually updated work by Robert G. Ibbotson and Rex A. Sinquefield).
- Indices are not available for direct investment. Their performance does not reflect the expenses associated with the management of an actual portfolio. Market, relative price, and size premiums (1975-2012) provided by Fama/French. Profitability premium computed by Dimensional using CRSP and Compustat data. Profitability is measured as operating income before depreciation and amortization minus interest expense, scaled by book. The annual profitability premium is computed as the average annual return on six high profitability groups of stocks (Large High Book-to-Market High Profitability, Large Medium Book-to-Market High Profitability, Large Low Book-to-Market High Profitability, Small High Book –to-Market High Profitability, Small Medium Book-to-Market High Profitability, and Small Low Book-to-Market High Profitability) minus the average annual return on six low profitability groups of stocks (Large High Book-to-Market Low Profitability, Large Medium Book-to-Market Low Profitability, Large Low Book-to-Market Low Profitability, Small High Book –to-Market Low Profitability, Small Medium Book-to-Market Low Profitability, and Small Low Book-to-Market Low Profitability). Term premium (1927-1972 provided by © Stocks, Bonds, Bills, and Inflation Yearbook ™, Ibbotson Associates, Chicago (annually updated work by Robert G. Ibbotson and Rex A. Sinquefield). Credit premium data (1973-present) provided by Barclays Bank PLC.
![]()